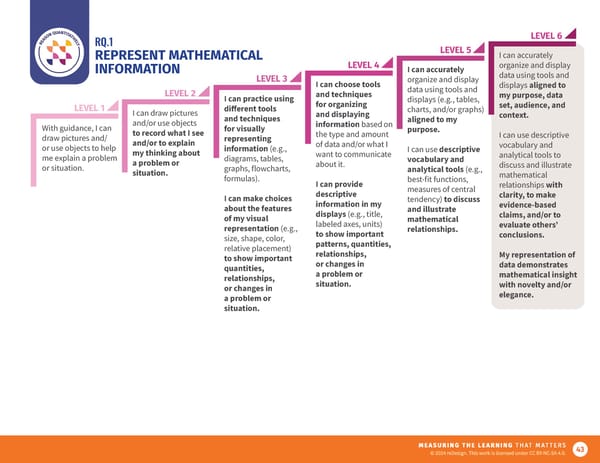
RQ.1 LEVEL 6 REPRESENT MATHEMATICAL LEVEL 5 I can accurately INFORMATION LEVEL 4 I can accurately organize and display LEVEL 3 organize and display data using tools and LEVEL 2 I can choose tools data using tools and displays aligned to I can practice using and techniques displays (e.g., tables, my purpose, data LEVEL 1 di昀昀erent tools for organizing charts, and/or graphs) set, audience, and I can draw pictures and techniques and displaying aligned to my context. With guidance, I can and/or use objects for visually information based on purpose. draw pictures and/ to record what I see representing the type and amount I can use descriptive or use objects to help and/or to explain information (e.g., of data and/or what I I can use descriptive vocabulary and me explain a problem my thinking about diagrams, tables, want to communicate vocabulary and analytical tools to or situation. a problem or graphs, flowcharts, about it. analytical tools (e.g., discuss and illustrate situation. formulas). best-fit functions, mathematical I can provide measures of central relationships with I can make choices descriptive tendency) to discuss clarity, to make about the features information in my and illustrate evidence-based of my visual displays (e.g., title, mathematical claims, and/or to representation (e.g., labeled axes, units) relationships. evaluate others’ size, shape, color, to show important conclusions. relative placement) patterns, quantities, to show important relationships, My representation of quantities, or changes in data demonstrates relationships, a problem or mathematical insight or changes in situation. with novelty and/or a problem or elegance. situation. 43
 Future9 Framework Page 42 Page 44